Introduction
Iris flower classification is regarded as the “Hello World” of machine learning.
Purpose
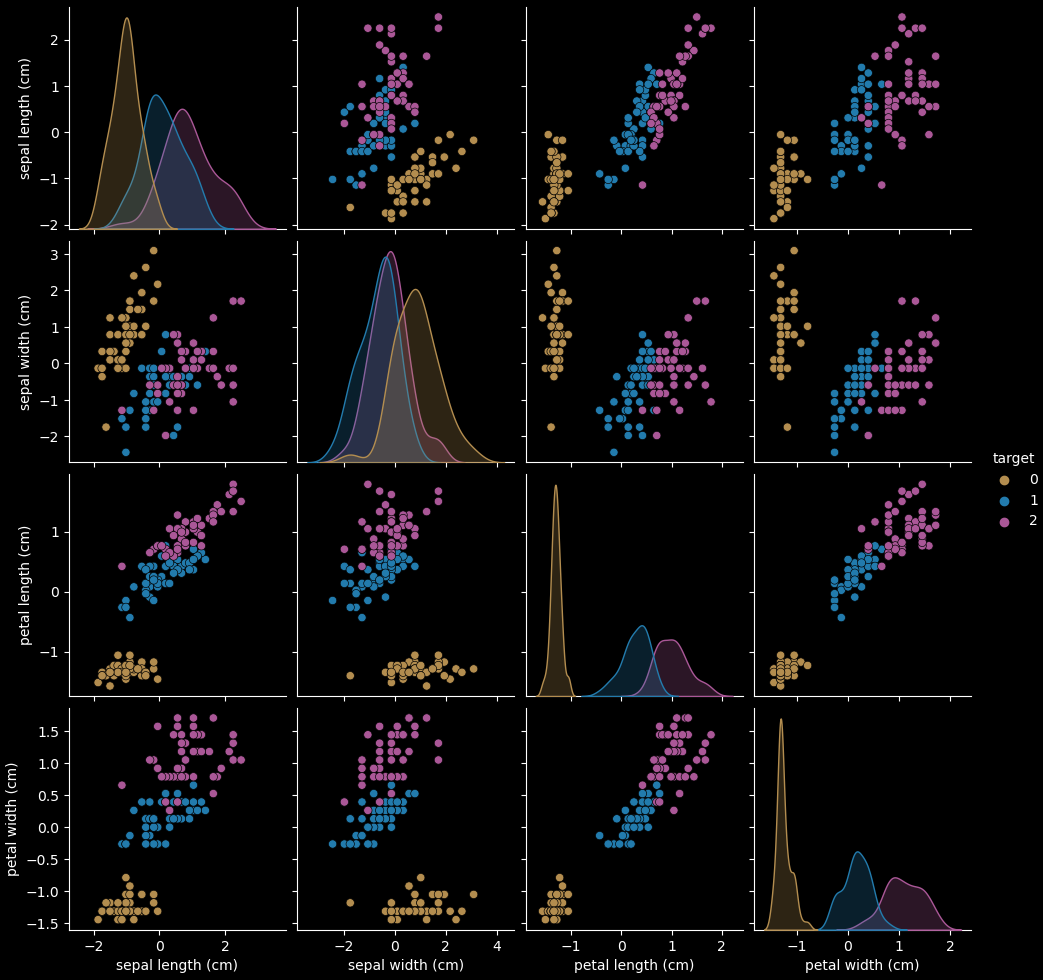
Three species of the iris flower, Versicolor, Setosa, and Virginica , are classified using four features: “Sepal length”, “Sepal width”, “Petal length”, and “Petal width”.
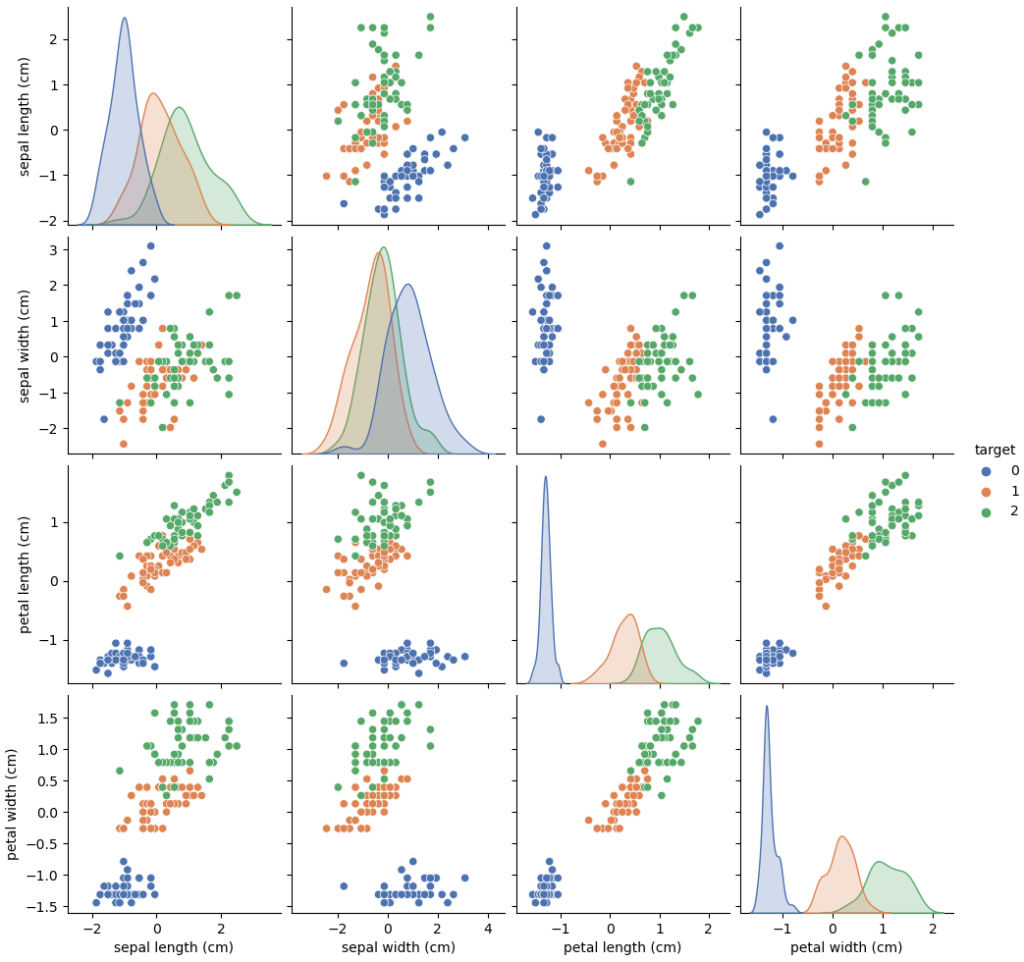
In this pair plot, the blue points represent the Setosa species, the orange points represent the Versicolor species, and the green points represent the virginica species. We can see that Setosa flowers are the shortest and the Virginica are the longest.
I used the LinearSVC algorithm from Scikit-Learn to train my machine learning model:
Code
from sklearn.datasets import load_iris
from sklearn.svm import LinearSVC
from sklearn.pipeline import make_pipeline
from sklearn.decomposition import PCA
from sklearn.model_selection import train_test_split
from sklearn.preprocessing import StandardScaler
from sklearn.metrics  import accuracy_score
from sklearn.metrics import classification_report
import matplotlib.pyplot as plt
import seaborn as sns
import numpy as np
import pandas as pd

iris = load_iris()

df = pd.DataFrame(data=iris['data'], columns = iris['feature_names'])

df = pd.DataFrame(iris.data, columns=iris.feature_names)
df['target'] = pd.Series(iris.target)

#df.to_csv('iris.txt', sep = ',', index = False)

df_scaled = df.copy()
data = df.values

scaler = StandardScaler()
df_scaled.iloc[:, [0, 1, 2, 3]] = scaler.fit_transform(df_scaled.iloc[:, [0, 1, 2, 3]])
data_scaled = df_scaled.values

X =  data_scaled[:,0:4]
Y = data_scaled[:,4]
X_train, X_test, Y_train, Y_test = train_test_split(X,Y,test_size=0.3)

svc = LinearSVC()
svc.fit(X_train, Y_train)
sns.pairplot(df_scaled,hue='target',palette='deep')predictions = svc.predict(X_test)
print(accuracy_score(Y_test, predictions))
print(classification_report (Y_test, predictions))
#Precision: ~0.95
#Recall: ~0.95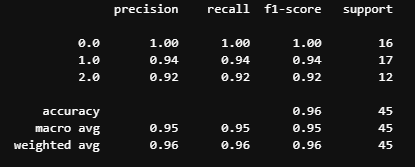
Summary
The machine learning model has high precision and recall, which means it is predicting the species of Iris flower accurately.